- This function is implemented in the following editions.
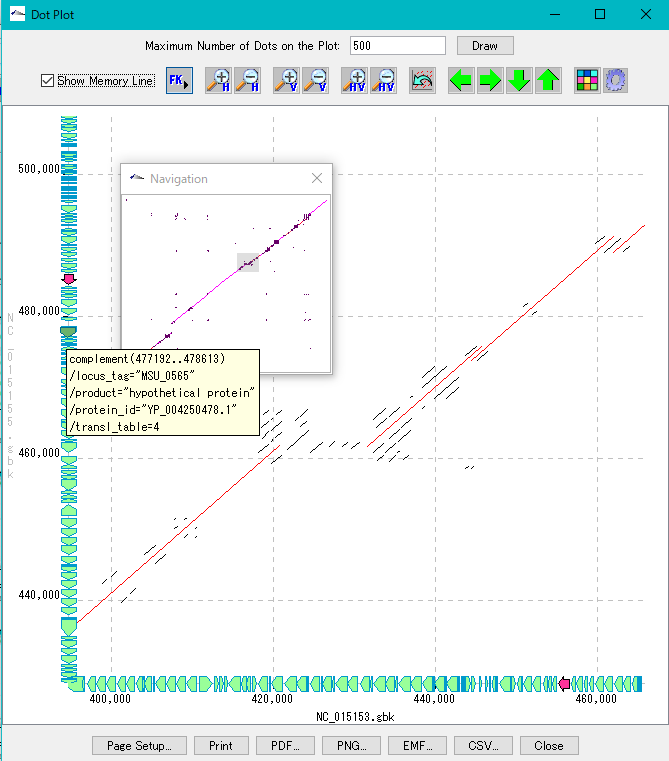
- We display homology regions between two genomic sequences in dot matrix.
- Select and compare the current genome sequence and one genomic sequence loaded in the current reference directory.
- You can set dot color by Overlap base length,% Identity level.
- In the result display window, zooming, shifting, enlarging an arbitrary region selected by rectangle, dot color setting, navigation window, restriction on the number of display dots, and feature key display (display of annotations with feature - mouse-over) are possible.
- A dot image can be output as a file in PDF / PNG / EMF format, and print setting is also possible.
- The dot list can be output as a file in CSV format.